
by Erin Weisbart

This explains how to set up a Dashboard in Amazon Web Services (AWS) Cloudwatch, which widgets we find most helpful for monitoring Distributed CellProfiler (DCP) runs in our Cloudwatch Dashboard, and what you might learn from each widget.
AWS Cloudwatch Dashboards are “customizable home pages in the CloudWatch console that you can use to monitor your resources in a single view [and] create customized views of the metrics and alarms for your AWS resources.” A Dashboard is full of widgets, each of which you create and customize to report on a separate AWS metric.
The Dashboard setup that we suggest below can be helpful to monitor a DCP run as it is occurring or for a post-mortem to better understand a previous run. Some things you can see include: whether your machines are sized appropriately for your jobs, how stable your spot fleet is, whether your jobs are failing and if so if they’re failing in a consistent manner. All told, this can help you understand and optimize your resource usage, thus saving you time and money!
Creating a Dashboard:
To create an AWS Cloudwatch Dashboard, from the Cloudwatch page of your AWS console, select Dashboards from the right sidebar and then Create Dashboard. It will immediately prompt you to create your first widget.
Our Recommended Dashboard Widgets:
FulfilledCapacity:
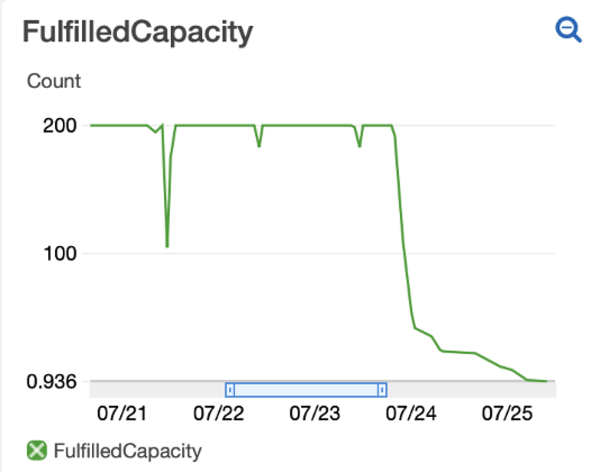
This widget shows the number of machines in your spot fleet that are fulfilled, i.e. how many machines you actually have at any given point. After a short spin-up time after initiating a run, you hope to see a straight line at the number of machines requested in your fleet and then a steady decrease at the end of a run as monitor scales your fleet down to match the remaining jobs.
Some number of small dips are all but inevitable as machines crash and are replaced or AWS takes some of your capacity and gives it to a higher bidder. However, every time there is a dip, it means that a machine that was running a job is no longer running it and any progress on that job is lost. The job will hang out as “Not Visible” in your SQS queue until it reaches the amount of time set by SQS_MESSAGE_VISIBILITY in your config file. For quick jobs, this doesn’t have much of an impact, but for jobs that take many hours, this can be frustrating and potentially expensive.
If you’re seeing lots of dips or very large dips, you may be able to prevent this in future runs by 1) requesting a different machine type 2) bidding a larger amount for your machines 3) changing regions. You can also check if blips coincide with AWS outages, in which case there’s nothing you can do, it’s just bad luck (that’s what happened with the large dip in the example above).
To create this widget:
First, you need to know the Request ID for your spot request. To get this, go to EC2 and select Spot Requests from the left sidebar. Select your spot request and note the Request ID from the bottom menu.
On your Cloudwatch Dashboard, click the Add widget button.
Select Line => Metrics => EC2 Spot => Fleet Request Metrics.
Search for “Fulfilled” and then check the box next to your fleet.
In the upper left corner, click the pencil and name this widget something informative like “Fulfilled Spot Fleet Capacity”.
In the lower right corner, select Create widget.
Note that this widget, unlike most, needs to be updated from run to run as each run will have a different Request ID. To edit this widget, click on the 3 dots in the upper right of the widget, and select Edit. In the All metrics tab, follow the instructions above to add your most recent Request ID. To remove older requests, in the Graphed metrics tab, deselect the old Request IDs.
Note that the default is for the y axis to scale to fit the data so a dip to the bottom of the graph doesn’t mean a drop to 0 machines. If you would like to manually set the y axis limit to 0, while you are creating or editing the widget, click the Graph Options tab. Under Left Y Axis set Limits Min to 0.
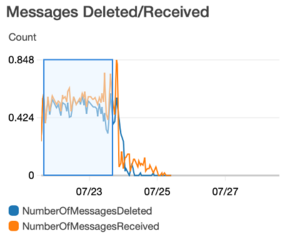
NumberOfMessagesReceived/Deleted
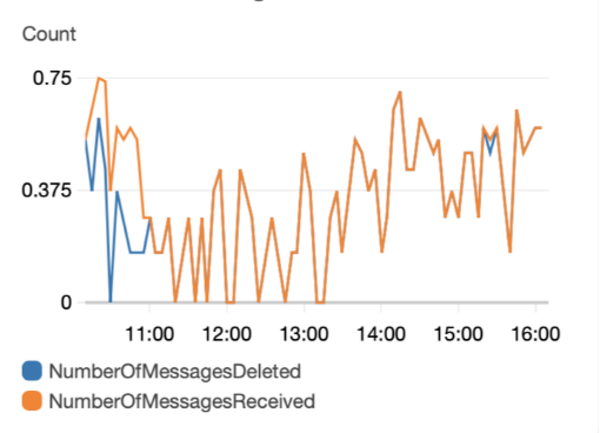
This widget shows you in bulk whether your jobs are completing or erroring. NumberOfMessagesDeleted shows messages deleted from the queue after the job has successfully completed. NumberOfMessagesReceived shows both messages that are deleted from the queue as well as messages that are put back in the queue because they errored. You hope to see that the two lines track on top of each other because that means no messages are erroring. If there are often gaps between the lines then it means a fraction of your jobs are erroring and you’ll need to figure out why (see MemoryUtilization and Show Errors or look directly in your Cloudwatch Logs for insights).
To create this widget:
On your Cloudwatch Dashboard, click the Add widget button.
Select Line => Metrics => SQS => Queue Metrics.
Search for your queue name and then check the box next to NumberOfMessagesReceived and NumberOfMessagesDeleted.
In the upper left corner, click the pencil and name this widget something informative like “Queue Messages Received/Deleted”.
In the lower right corner, select Create widget.
MemoryUtilization
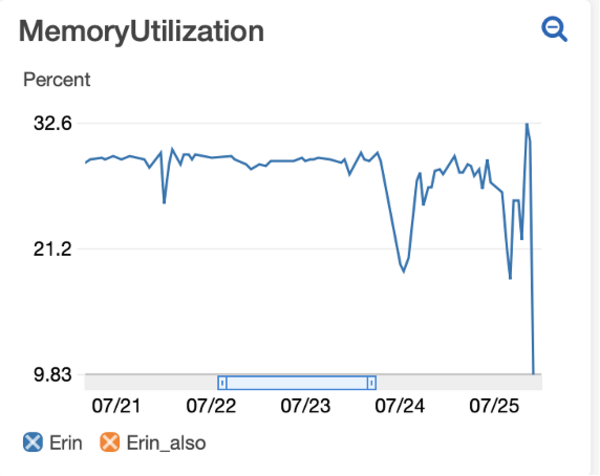
Insufficient memory is the error that we most often encounter (as we try to use the smallest machines possible for economy’s sake) so we like to look at memory usage. Note that this is showing memory utilization in bulk for your cluster, not for individual machines. Because different machines reach memory intensive steps at different points in time, and because we’re looking at an average across 5 minute windows, the max percentage you see is likely to be much less than 100%, even if you are using all the memory in your machines at some points.
To create this widget:
On your Cloudwatch Dashboard, click the Add widget button.
Select Line => Metrics => ECS => Cluster Name, Service Name.
Search for your cluster name and/or service name then check the box for MemoryUtilization. Note that you can select multiple clusters if you use more than one cluster.
In the upper left corner, click the pencil and name this widget something informative like “Memory Utilization”.
In the lower right corner, select Create widget.
MessagesVisible/NotVisible
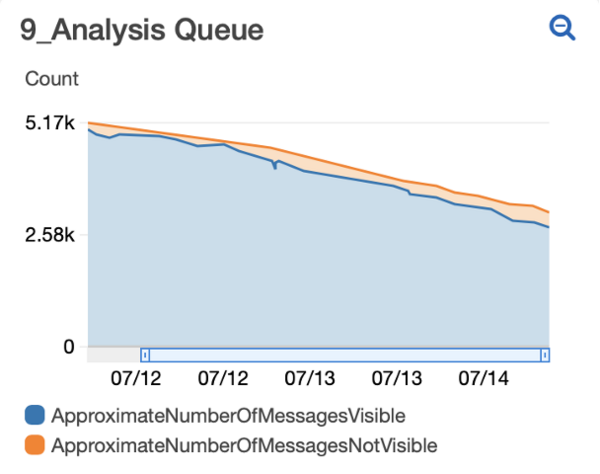
Visible messages are messages waiting in your queue. Hidden messages (aka MessagesNotVisible) have been started and will remain hidden until either they are completed and therefore removed from the queue or they reach the time set in SQS_MESSAGE_VISIBILITY in your config file, whichever comes first. (Read more about Message Visibility here.) After starting your fleet (and waiting long enough for at least one round of jobs to complete), you hope to see a linear decline in total messages with the number of hidden messages equal to the number of jobs being run (fleet size * tasks per machine * docker cores).
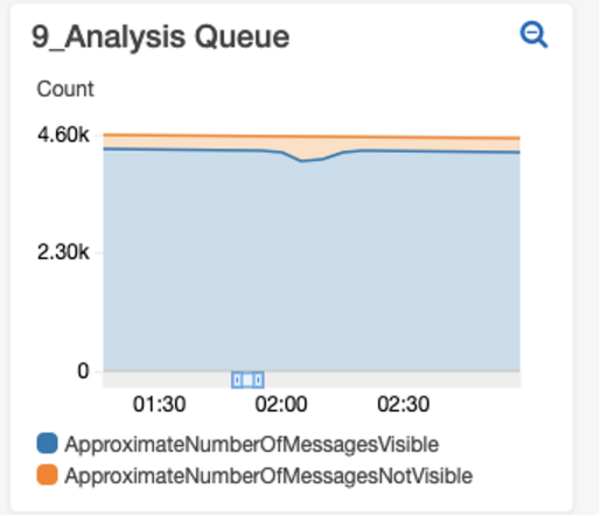
Sometimes you’ll see a blip where there is a rapid increase in the number of hidden messages (as pictured above). This can happen if there is an error on a machine and the hard disk gets full - it rapidly pulls jobs and puts them back until the machine error is caught and rebooted. This type of error shows in this widget as it happens.
If your spot fleet loses capacity (see FulfilledCapacity), you may see a blip in MessagesVisible/NotVisible where the number of hidden messages rapidly decreases. This appears in the widget the amount of time set in SQS_MESSAGE_VISIBILITY in your config file after the capacity loss when jobs that were started (i.e. hidden) but not completed return to visible status.
The relative slope of your graph can also be informative. For the run pictured at top, we discovered that a fraction of our jobs were erroring because the machines were running out of memory. Midway through 7/12 we upped the memory of the machines in our fleet and you can see from that point on a greater slope as more jobs were finishing in the same amount of time (as fewer were failing to complete because of memory errors.)
To create this widget:
On your Cloudwatch Dashboard, click the Add widget button.
Select Stacked area => Metrics => SQS => Queue Metrics.
Search for your queue name and then check the box next to ApproximateNumberOfMessagesVisible and ApproximateNumberOfMessagesNotVisible.
In the upper left corner, click the pencil and name this widget something informative like “Queue Message Visibility”.
In the lower right corner, select Create widget.
Distinct Logs with “cellprofiler -c”
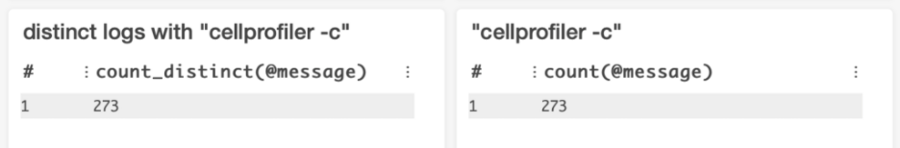
This widget shows you the number of different specific CellProfiler jobs that start within your given time window. It is not necessarily informative on its own, but very helpful when compared with the following widget.
To create this widget:
On your Cloudwatch Dashboard, click the Add widget button.
Select Logs Table.
In the dropdown box, select your log group.
In the text field, enter:
fields @message| filter @message like 'cellprofiler -c'| stats count_distinct(@message)
“cellprofiler -c”
This widget shows you the number of times that CellProfiler is started within your log group within the given time window. Ideally, you want this number to match the number in the previous widget as it means that each job is starting in CellProfiler only once.
If this number is consistently larger than the previous widget’s number, it could mean that some of your jobs are erroring and you’ll need to figure out why (see MemoryUtilization and Show Errors or look directly in your Cloudwatch Logs for insights).
To create this widget:
On your Cloudwatch Dashboard, click the Add widget button.
Select Logs Table.
In the dropdown box, select your log group.
In the text field, enter:
fields @message| filter @message like 'cellprofiler -c'| stats count(@message)
Show Errors
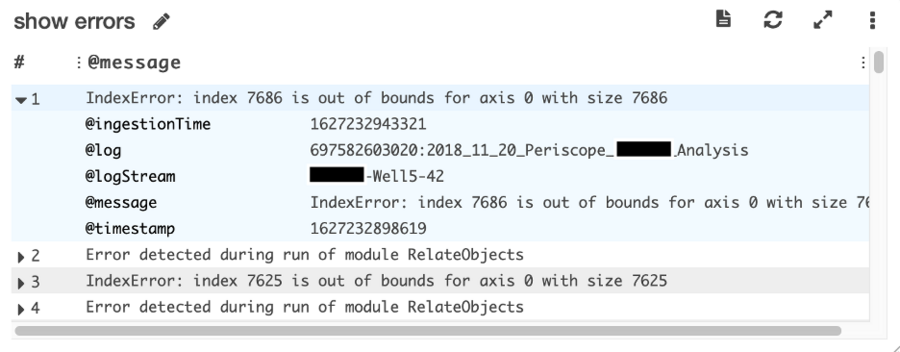
This widget shows you the log entry any time that it contains “Error”. Ideally, this widget will remain empty. If it is logging errors, you can toggle each row for more information - it will show the job that errored in @logStream and the actual error message in @message.
You can duplicate this widget and adjust the query for any specific error you would like to track by changing “Error” in the text field described below.
To create this widget:
On your Cloudwatch Dashboard, click the Add widget button.
Select Logs Table.
In the dropdown box, select your log group.
In the text field, enter:
fields @message
| filter @message like "Error"
| display @message
Interacting with a Dashboard:
Once you have your Dashboard created and full of widgets, you can adjust the timescale for which the widget is reporting metrics. For any of the widgets you can set the absolute or relative time that the widget is showing by selecting the time scale from the upper right corner of the screen. Zoom in to a particular time selection on a visible widget by drawing a box around that time on the widget itself (note that zooming in doesn’t change what’s plotted, just what part of the plot you can see so metrics like Show Errors won’t update with a zoom).
Some widgets allow you to select/deselect certain metrics plotted in the widget. To hide a metric without permanently removing it from the widget, simply click the X on the box next to the name of the metric in the legend.
You can move the widgets around on your dashboard by hovering on the upper right or upper left corner of a widget until a 4-direction-arrow icon appears and then dragging and dropping the widget. You can change the size of a widget by hovering on the lower right corner of the widget until a diagonal arrow icon appears and then dragging the widget to the desired size. After making changes, make sure to select Save dashboard from the top menu so that they are maintained after refreshing the page.
Creating a Duplicate Dashboard
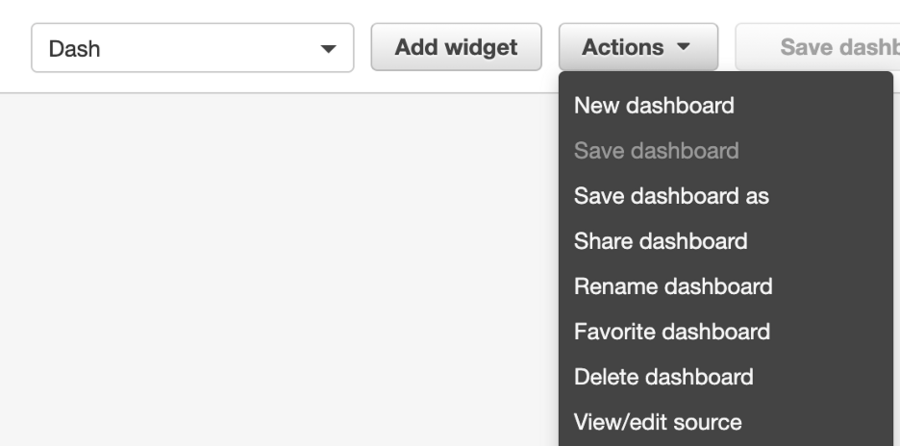
Most of these widgets rely on the SQS Queue Name or LogGroup name, both of which are by default derived from DCP’s APP_NAME setting in config.py. Each dashboard is therefore reusable for subsequent runs with the same APP_NAME, but needs some editing for a new APP_NAME. Once you have created your preferred dashboard, create a duplicate dashboard for a new APP_NAME by selecting Actions => Save dashboard as and entering a new name for your new dashboard.
To update your new dashboard for your new APP_NAME, you can individually edit each widget by clicking the 3 dots in the top right of each widget, selecting Edit, and then configuring the widget in a similar manner as you used to create it. Alternatively, you can update the whole dashboard at once by selecting Actions => View/edit source and replacing each instance of your old APP_NAME with your new one.