
Melissa Gillis
In the previous two sections of this blogpost I explained how I analyzed multiple methods to segment fluorescent images of collagen IV fibers, and generated accurate segmentation using an ilastik machine learning model. In this section I will explain how I constructed a CellProfiler pipeline to analyze the properties of the fibers.
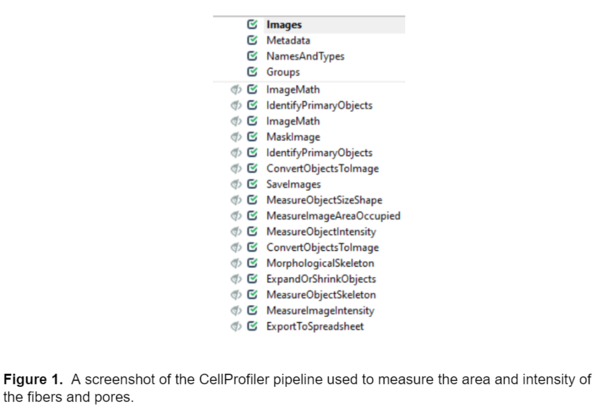
After I was satisfied with the ilastik probability maps, I used them to construct a pipeline in CellProfiler to segment and measure the area and intensity of the fibers and the pores (the negative space not taken up by the fibers.) The pipeline modules are shown in the screenshot below.
Loading Images (Images, Metadata, NamesAndTypes, and Groups modules)
I organized the Images module so it contains three images in each set, the raw image, the background probability map, and the fiber probability map. The model in ilastik is set up so the probability map files end with Probability_0 and Probability_1 for background and fibers respectively, and CellProfiler uses this file name distinction to collect the images into image sets in the NamesAndTypes module.
Image analysis (all remaining modules)
The image processing and analysis modules begin with the ImageMath module, which subtracts the background probability image from the fiber probability image to further enhance our ability to detect fibers. All future analysis steps are performed with the image resulting from the ImageMath step, except for intensity measurements which are performed with the raw data.
The next module is IdentifyPrimaryObjects, which segments the fibers. I had to adjust the advanced settings of this module quite a bit to get the module to accurately identify the fibers. Some of the most important features I changed in the advanced settings were 1) including fibers that were touching the edge of the image in the analysis, 2) not filling any holes in the fibers to more accurately represent their true morphology 3) changing the method for distinguishing clumped objects to shape and 4) changing the thresholding from two class to three class and assigning pixels in the middle intensity range to the background. After adjusting the IdentifyPrimaryObjects module, I was able to accurately segment and measure properties of the fibers in CellProfiler. While this module is very good at isolating the fibers from the background, it should be noted that it is not meant to segment all the individual fibers. Because the fibers are so densely packed together, it is very difficult to distinguish the individual fibers from one another so any fiber-level measurements should be interpreted with caution. The next three modules, ImageMath, MaskImage, and IdentifyPrimaryObjects invert the image and segment the pores (the negative space not taken up by the fibers.) The ConvertObjectToImage and SaveImages modules save the label matrices for the fibers and pores.
The next few modules: MeasureObjectSizeShape, MeasureImageAreaOccupied, and MeasureObjectIntensity all perform basic measurements on the fibers and the pores, and this information is exported to a .csv file (openable in Excel or other analysis software) at the end of the pipeline. A small note on measuring intensity values: some of the images contained saturated regions, meaning intensity-based measurements, especially mean intensity, cannot be accurately measured. Using median or lower quartile intensity measurements are less likely to be impacted by saturated pixels, unless >½ or >¾ of the image is saturated, respectively.
The next few modules convert the fibers to a morphological skeleton (ConvertObjectToImage and MorphologicalSkeleton) and shrink this skeleton down (ExpandOrShrinkObjects) to characterize the structure of the individual fiber. The MeasureObjectSkeleton module measures the branching behavior of the individual fibers segmented from the image.
Finally, ExportToSpreadsheet exports these measurements to a .csv file. When run to completion the pipeline will produce four separate excel sheets titled MyExpt_Fibers, MyExpt_Image, MyExpt_Pores, MyExpt_small_fiber, and a folder titled Labels. The “Labels” folder contains the label matrices for each image processed in the pipeline. The excel files contain all the data measured including area and intensity for fibers and pores within the image. MyExpt_Image contains information on the image as a whole, such as the percentage of the total area of the image occupied by fibers. MyExpt_Fibers and MyExpt_Pores contain area and intensity data about each fiber and pore in the image respectively. These files also have the mean intensity and area for each fiber/pore in an image. The MyExpt_small_fiber file contains data about the branching and general structure of the fibers including the number of branch ends, non-trunk branches and number of trunks on each fiber.
After running all the images through the pipeline I was able to run some analysis on the images. In the final section of this blogpost I will discuss some of the analysis done on the data from these images.
Customizing a Model for Fiber Segmentation Series:
Part I: Investigating Possible Methods
Part 2: Creating an ilastik Model
Part 3: Constructing a CellProfiler Pipeline
Part 4: Analyzing the Results