
Melissa Gillis
In the final section of this blogpost series, I will discuss some of the benefits and drawbacks of this model and discuss some of the data I acquired from the images.
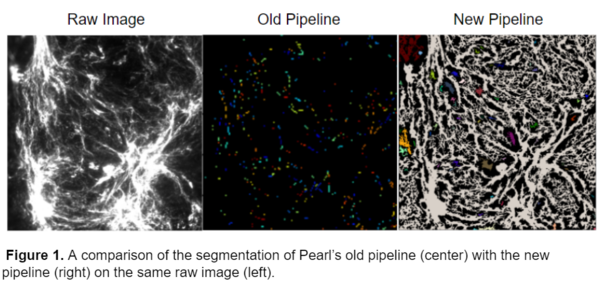
This model was able to successfully segment the images that were not able to be accurately segmented by Pearl’s original pipeline. A comparison of the pipelines on the same raw image is shown below.
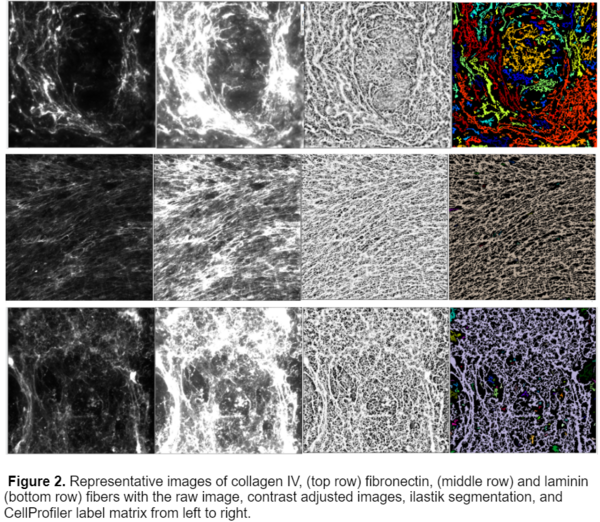
This workflow was able to successfully process 3 different kinds of fibers, collagen IV, fibronectin, and laminin.While I originally started the analysis with only 20x Collagen IV images, I later obtained images with fibronectin and laminin with varying magnifications including 4x, 10x, and 40x. After training the ilastik model on these images I was able to produce a model that worked for all 3 fiber types and magnifications, an example of the segmentation is shown below.
Limitations
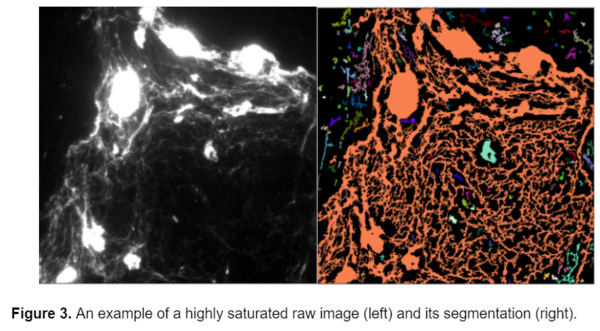
One of the main problems that I faced with this data set was that some of the images were saturated. In certain areas, there are large masses of collagen that saturate the image (see below), and obstruct the underlying structure of fibers. Because these large collagen blobs are identified as fibers by CellProfiler they affect the area and intensity calculations. Unfortunately this can't be corrected using image analysis, it would have to be corrected while acquiring the images.
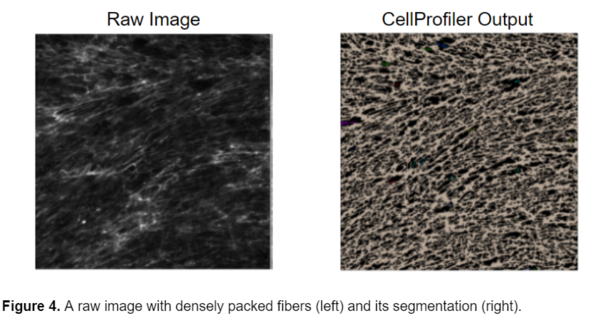
While this model can successfully segment the fibers from the background, it cannot segment individual fibers. Because the fibers are so densely packed together, it is very difficult to distinguish the individual fibers from one another. Unfortunately, the nature of the fibers and the experimental condition prevents the individual fibers from being clearly visible and therefore they cannot be individually segmented.
Experimental analysis
For this data set I was lucky enough to have ground truth measurements of the images. The Gaborski lab had previously measured the intensity of the fibers by selecting a ROI in the image and calculating the mean intensity in FIJI. I compared this data with the CellProfiler measurements by taking the median intensity of each fiber in an image. The results are shown below.
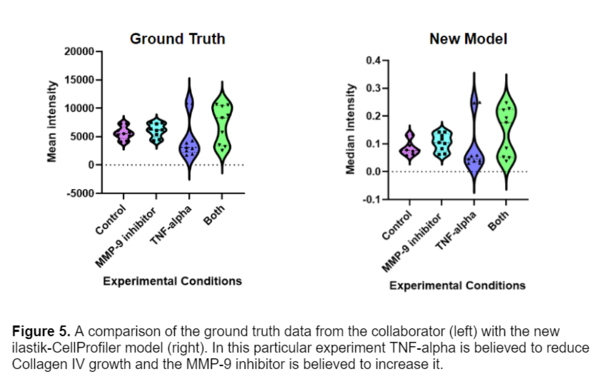
It is promising to see that the data follows the same general trends, and the two methods seem to produce similar results. The CellProfiler pipeline is able to acquire more accurate data since it is accounting for the intensity of each fiber in the image, instead of just a ROI. The only thing drastically different about the two datasets are the values of intensity, this difference in the units comes from how pixel intensity values are scaled in CellProfiler to range from 0 to 1.
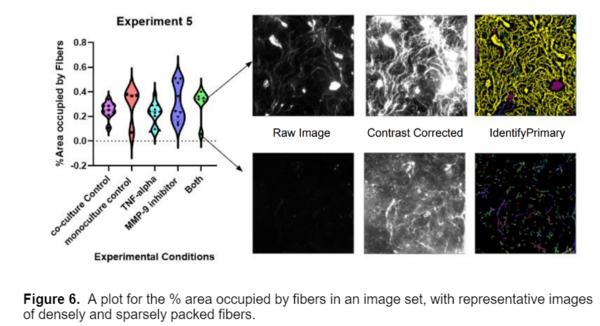
In addition to intensity, I also generated plots for the % Area Occupied by fibers in each image. After noticing a bimodal distribution in some of the plots, I looked over some of the raw images and found that this distribution was due to experimental variance within the data, as shown below.
Overall, the model proved very successful; it can accurately segment and measure three types of fibers across multiple fields of view. I would like to thank Louis Widom and Tom Gaborski for sharing their data and making this blog post possible. I hope you found this blogpost helpful! Please reach out to connect with the CellProfiler team and imaging community via the Scientific Community Image Forum at image.sc if you have any questions.
Customizing a Model for Fiber Segmentation Series:
Part I: Investigating Possible Methods
Part 2: Creating an ilastik Model
Part 3: Constructing a CellProfiler Pipeline
Part 4: Analyzing the Results