Pearl V. Ryder
One thing I’ve found very helpful in my journey as an image analyst is learning from others by observing their thought process when they tackle a new problem. In this series of five blog posts, my goal is to share how I approached an image analysis project that I recently undertook as part of the Center for Open Bioimage Analysis.
The project
Tom Gaborski’s NanoBio Materials Laboratory at the Rochester Institute of Technology studies how porous substrates affect the extracellular matrix, which has important consequences for cell migration. Their group uses immunofluorescence microscopy to assay the formation of connective tissue fibers secreted by cells. Their goal for our team was to develop an analysis method to automatically quantify the morphology of fibrils and compare fibril morphology when cells are cultured on substrates of different porosity. This dataset was originally published by Chung et al. in ACS Biomaterials Science & Engineering, where you can learn more about the experiment and results.
The approach
As you’ll see below, I try to break up my image analysis project into discrete tasks and then work on each of those tasks in turn. A typical project will require importing data, segmenting objects, making measurements, and then exporting the data. Most of these steps are straightforward, with the possible exception of segmentation. In order to accurately segment objects of interest, we need an image where the things that we care about are bright and everything else is dark. If your images don’t look like this initially, you can add processing steps in order to increase the brightness of objects of interest and decrease the brightness of other objects and the background.
For example, with this dataset, I found that many images contained bright debris. I masked the debris out, so that nothing in the image was brighter than my objects of interest. I also performed a background subtraction, which helped to reduce the intensity of everything that wasn’t an object.
Sometimes these steps can feel like a winding road, but recognizing where you are in your pipeline building process can help you stay focused and on track. I find it especially helpful to write down the steps I think I need to do as a way to scope out the project. In a series of several posts, you’ll see each of the tasks that led to a finished pipeline for this project.
Getting oriented to the dataset
The first step in building any pipeline is understanding the underlying data. This dataset contains 16-bit images of human umbilical vein endothelial cells (HUVECs) taken at 40X magnification that contain three channels: phase contrast, GFP, and TxRed. Our analysis will focus on the GFP channel only, which captures the connective tissue protein fibronectin labeled with Alexa Fluor® 488 anti-fibronectin antibody. The HUVECs were grown on three substrates of different porosity and imaged at three different timepoints.
Configuring the input modules
Our collaborators wanted a reproducible pipeline that could be run on dozens of images automatically and tuned by them when needed, so I turned to CellProfiler because it can be adjusted by non-experts and conveniently run on new projects. To start, I needed to configure CellProfiler to import the images and extract the relevant experimental metadata for each image. In doing so, the measurements that we eventually make will be linked to an experimental condition.
This dataset is structured within folders for the timepoint (hr_6, hr_12, hr_24), the substrate (NP = nonporous, HP05 = 0.5 micron pores, HP3 = 3 micron pores), and the image replicate number (01, 02, 03, etc.). Each file name also contains this information and contains a separate channel (Phase, GFP, or TxRed). There are also 10X images and .nd2 files within the dataset that we don’t want to analyze in CellProfiler.
As an overview, my goals with the input modules were to:
1. Exclude the 10X images and non-tiff files
2. Capture the substrate, timepoint, and replicate data
Excluding images from analysis within the Images module
A simple way to exclude images from the analysis is to add a filter within the input module. In this pipeline, I applied filters to include only tiff files that do not contain the expression 10X.
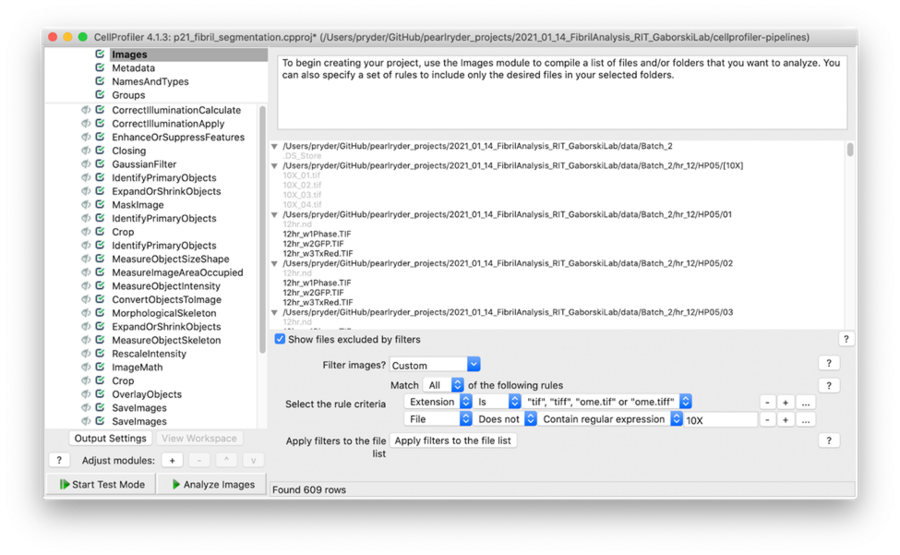
Screenshot showing the filters used to exclude 10X images and include tiff files only
Capturing metadata using the Metadata module
Next, I wanted to capture the experimental metadata for each image using the Metadata module. I used the regular expression .*[/V](?P<time>hr_[0-9]*)[\/](?P<substrate>.*)[\/](?P<image>.*) to the folder names in order to get the time, substrate, and image replicate number. I then extracted the timepoints and the channels from the image names using the regular expression ^(?P<timepoint>.*)_w[0-9](?P<channel>.*).TIF. The CellProfiler help has detailed information on how regular expressions work. They can be tricky to configure, but are powerful and well worth learning!
I’ve now assigned each image a substrate, timepoint, channel, and replicate number. The next step is to group those together using the NamesAndTypes module into an image set (all of the channels for a single field of view).
Creating an image set using the NamesAndTypes module
In the NamesAndTypes module I applied names to images matching rules in order to create named GFP, Phase, and TxRed images. I then used metadata matching to associate each image into an image set that has the same substrate, timepoint, and replicate number. Note that in this particular example, I didn’t end up using the data in the Phase or TxRed channels, which means they don’t need to be included as images in the dataset (I could have included only the GFP images in the first step when importing images). When I built the pipeline, I wasn’t sure if I’d want them, so I went ahead and included them here.
In Part II of this series, I’ll demonstrate my method to remove very bright debris from the analysis, which helps to create an image where I can ultimately segment the fibrils.