Beth Cimini
One of the most common questions I’m asked when helping a collaborator with an image analysis project is:
“How do I know when my analysis workflow is doing well enough at finding the objects or measuring the things I care about?”
Unfortunately, it’s also one of the hardest questions to answer! In an ideal world, we’d be able to achieve perfect recognition and/or segmentation of our biological objects every time, and get out perfect data! Alas, biology is almost never so accommodating, even ignoring the effects of technical artifacts.
Ultimately, “what is the universal truth” and “how close to universal truth must we be for something to still be called true” are philosophical questions. In analyzing finite samples of data, we are attempting to create a model of what we think is going on in the real world — however, as the statistician George Box said, “all models are wrong”.
Good enough to be useful?
But Box also said later on: “all models are wrong, but some models are useful”. How right do our image analysis workflows have to be in order to be useful? As much as I wish this question had a simple answer, it’s pretty much always case dependent. As scientists, we always want to report answers as accurately as we can; this drive, though, can sometimes make it hard to sense when we’re approaching a point of diminishing returns (there are more than a few hours of my life that might have been better spent watching a movie or having coffee with friends than improving a pipeline’s accuracy from 93% to 96%), or when we’re trying to analyze images that are ultimately so unsuitable we’d spend less time just retaking them.
If you, like me, find it hard to know when to set the keyboard down and walk away, here’s a rule of thumb: for every change you consider making to your analysis workflow (which I’ll refer to here as a “pipeline”, though it can be any way you process images) you should consciously weigh the following factors:
- How wrong is my current pipeline output?
- How close to 100% accurate is it possible to get?
- How close to accurate do I need to be to assess the % or fold change I expect to see in this experiment?
- How important is this accuracy of this segmentation to my overall hypothesis?
- What else could I do in the time it will take me to make my pipeline maximally accurate?
Finding “good enough”
Here I’ll talk about two major aspects of image analysis (thresholding and object segmentation), discuss common pitfalls and how we try to get the “least wrong” answer, and discuss how we typically weigh the above factors in our lab. While I’ll largely discuss these things in the context of CellProfiler, it’s worth noting these principles apply to all (classical) image analysis, with every software! While my examples below are of nuclei, these principles are generally applicable — from an organelle to an organism.
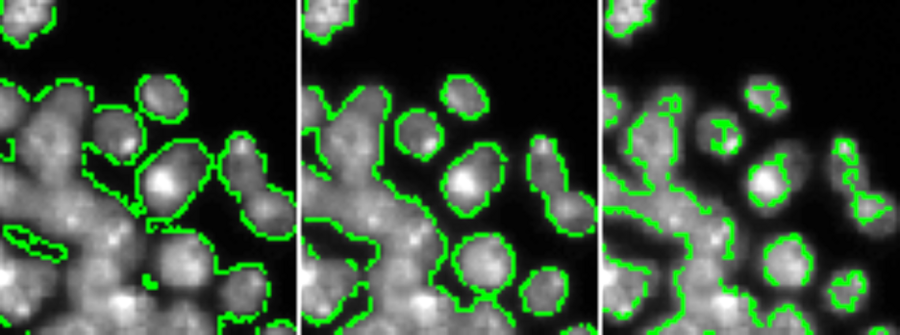
There are two major steps to segment objects. First, you determine the threshold of “signal” that distinguishes foreground from background — “signal” often refers to the amount of a fluorescent dye present, but a probability map from ilastik or FIJI’s WEKA plugin can also be a great input!
In the example below, DAPI intensity has been thresholded at an algorithmically determined value (center), 0.5X that value (left), or 2X that value (right) — too low a value includes too much background, too high a value excludes parts of nuclei, so ideally we want to hit a “Goldilocks” value somewhere in the center.
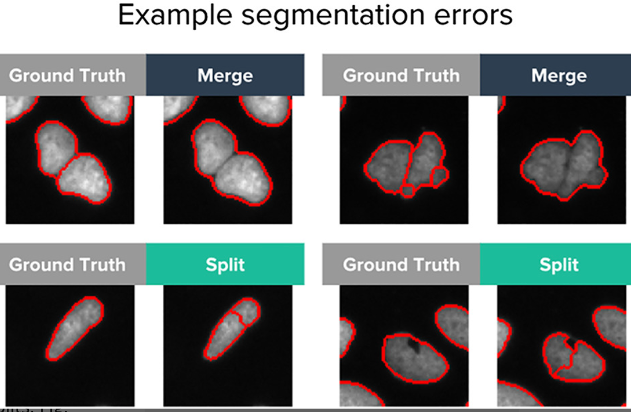
Second, you need to determine how you will break the areas that have been called “background” and “foreground” into discrete objects — in our terminology, we often refer to this as “declumping”. When what should have been called one object is broken into two or more objects, this is often called “oversegmentation” or “splitting”; when what should have been two or more objects is called only one objects, this is often referred to as “undersegmentation” or “merging”.
Recent work from our group suggest that neural networks may be less prone to these sorts of errors than classical methods, but neural networks still do make both kinds of segmentation errors.

Thresholding and declumping parameters are easy to determine for any given object, but can be hard to set globally for a whole image and especially hard for a whole experiment. Let’s consider our 5 factors, in the context of segmentation:
1. How wrong is my current pipeline output?
If you have manually annotated ground truth, you can answer this quantitatively (in CellProfiler, this is the MeasureObjectOverlap module). While it’s usually not that hard to make manually annotated ground truth, it can take a VERY long time, so most people don’t bother for most experiments. You can hand label a small test set, as an intermediate measure, but in most cases when we’re prototyping we assess this qualitatively.
In order to do this qualitative assessment, in our lab we typically try to look at the following:
- Do I generally agree with most of the object segmentations from my analysis workflow? If not, the rest of the questions below likely don’t matter too much.
- Overall across my experiment, do I have an approximately equal number of regions/images where the threshold chosen by the algorithm for this image is a bit too low vs where the threshold chosen by the algorithm is a bit too high?
- Overall across my experiment, do I have an approximately equal number of oversegmentations/splits and undersegmentations/merges?
- Very important: Do both the second and third bullet points hold true for both my negative control images and my positive control (or most extreme expected phenotype(s) sample) images?
2. How close to 100% accurate is it possible to get?
To some degree, this depends on knowing your objects and/or your field a bit — if this is a thing that’s been studied by microscopy a lot, there are hopefully pretty good pipelines, if not there may not be. If your objects are pretty “standardized” in their appearance, you’re more likely to have a higher possible accuracy than if they’re really variable. Good images are also critical here — garbage in, garbage out.
3. How close to accurate do I need to be to assess the % or fold change I expect to see in this experiment?
Do you expect the phenotypes you care about to be 20% different from negative control? 2000% different? How much variability do you expect, and how many samples will you have? Ultimately, this question can be answered with a power analysis and a few reasonable guesses.
4. How important is this aspect of my experiment to my overall hypothesis?
This is hard to put a number on, but qualitatively:
- If you’re trying to test whether overexpressing GeneA causes cells to stop dividing, cell size (and therefore accurate cell borders) is probably really important!
- If you’re trying to tell if overexpressing GeneA causes GFP-GeneB to be overexpressed (and GFP-GeneB is diffuse in the cytoplasm), a rough cell outline is probably sufficient since you really care more about the mean intensity of GFP-GeneB.
- If you’re trying to test if Drug123 causes mCherry-GeneC to translocate into the nucleus, the exact outlines of the nucleus are very important!
- If you’re trying to test if Drug123 causes mCherry-GeneC to translocate into the mitochondria, the exact outlines of your nucleus are probably not that critical (but in that case, mitochondrial segmentation will be pretty important!).
5. What else could I do in the time it will take me to make my pipeline maximally accurate?
You may want to spend a lot of time optimizing your pipeline if any or all of the following conditions are met:
- You have a small number of samples
- You have a pipeline that’s currently really wrong
- Your pipeline is really wrong in a way that might really obscure the features most important to testing your overall hypothesis (because it treats your negative and positive controls quite differently, because the most important structures aren’t identified accurately, etc)
In the case that all three are true, it might even be worth annotating some data by hand so that you can quantitatively track the ability of your pipeline to measure your most important object segmentations.
Try to set yourself benchmarks ahead of time though — it might be worth spending 6 more hours or even 6 more days working on this, but will it really be worth 6 more weeks?
If your ultimate goal isn’t super dependent on precise segmentation, and your pipeline works pretty well on most cases (and equally well across your most phenotypically different cases), stop working on this, and go do other cool science (or non-science things)!
Edit, January 2024: This blog post now has a Zenodo DOI, if citing is your thing!