Rebecca Senft
With slide scanners and other automated, high-throughput microscopes becoming more and more common, it’s important to understand how to work with the large image files they produce. Whole slide file formats (e.g., .mrxs, .svslide, .svs, .vms) are often massive when uncompressed (>40 GB) and are commonly used when imaging tissue sections for histology. Here we’ll show you step-by-step how to use QuPath annotations and scripting to export smaller, full-resolution tiles of large whole slide histology images. These tiles can be useful for training machine learning classifiers or in general for working with your images in other programs that are not well suited for whole slide image formats. For this post, we’ll be focusing on the MIRAX format, but the general steps can be generalized to other image formats openable in QuPath.
Please note that we will be using QuPath version 0.3.2. Older versions of QuPath will likely have different behavior when it comes to exporting annotated regions and may use the annotation bounding box, sometimes producing more tiles than desired.
Images of tissue sections in this blogpost are generously provided by the Barczak Lab, MGH.
1. Organize your images
First, get all your images in one location. Images should be in a folder structure something like this:
.
└── raw_data/
    └── Expt_1_condition_1/
        ├── sample_id/
        │   ├── Data0001.dat
        │   ├── Data0002.dat
        │   ├── ...
        │   └──  Slidedat.ini
        └── sample_id.mrxs
This might be slightly different for you depending on your specific experimental details, but generally MIRAX format images like these have one .mrxs file and a folder with many .dat files. The .dat files contain the image information in different pieces at different resolutions. The .mrxs file contains metadata and information about how the different .dat files fit together. You need all the files to have full access to the data.
This type of image format, where information is represented at different levels with different resolutions, is often called a pyramidal image or hierarchical image (see below).
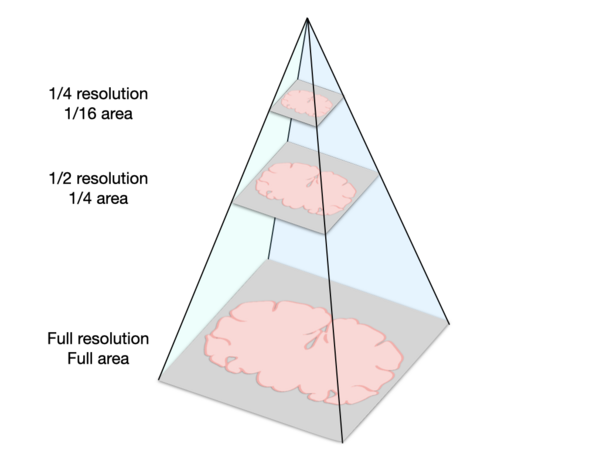
Here is a schematic representation of a pyramidal image, which stores image data at multiple scales to enable quick loading of very large images. These images have two dimensions, so halving the resolution along both dimensions produces images with a quarter of the original area.
Why use pyramidal images? Normally when you load an image into a program, the whole image is loaded into your computer’s memory which can slow or freeze your application. For example, if you open a very large image in FIJI to view it, it can be prohibitively slow. The major advantage to pyramidal images is that they enable working with images that are many times larger than what your computer can hold in memory. They do this by only loading the sections of the image that you are trying to view at a given time, and by loading the resolution that is appropriate for the level of zoom. So when you initially view the whole slide or section, the computer will load a low resolution version of the data. As you zoom in, the computer will load a higher resolution of just the part of the slide you’re trying to view. Unfortunately, this feature is only available in software that utilizes the pyramid structure of these images, like QuPath. Though FIJI and other image analysis programs like CellProfiler may have some support for opening a part of a pyramidal image using bioformats, full support for the pyramidal structure is currently missing for most file formats. Thus, to be able to work with our images in other software, it is useful to split them into smaller, full-resolution tiles.
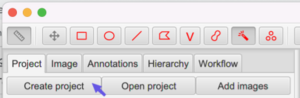
2. Make a project in QuPath
Click “Create Project” or alternatively, File > Project… > Create Project
The folder you choose must be an empty folder. I recommend making a new folder called qupath_project and putting the raw_data folder inside.
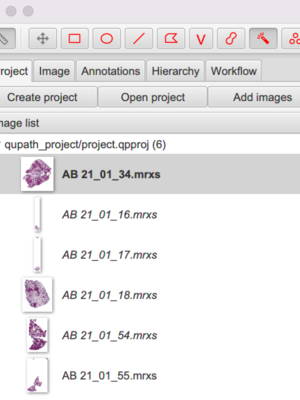
3. Add images to the Qupath project
Drag and drop the .mrxs file for each image into the QuPath Image list.
It will look something like this as you add more images:
4. Add an annotation for the section or region of interest
Now we’re going to create an annotation for each section to indicate our regions of interest. We do this because the images for this experiment contain a lot of white areas that we don’t care about and don’t want to turn into tiles. If you don’t want to crop the image to a particular region, you can skip this and just set
.annotatedTilesOnly to false in the script (Step 6).
I like using the magic wand

to define the section by clicking and dragging to annotate, but there are other options like the brush tool

or polygon tool

which could also be useful. When using the magic wand, you do not have to annotate the section in one go; you can add more to an annotation as long as you start drawing from within the original annotation. You can also undo with cmd+z / ctrl+z.
Here’s an example of a tissue section with an annotation (yellow outline):
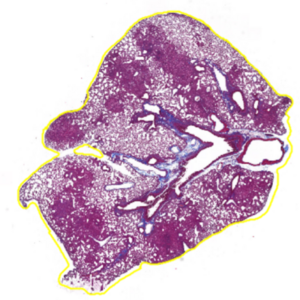
TIP: You want one continuous outline outside the whole section, not a bunch of smaller lines within the section. You can also go to the ‘Annotations’ tab on the left under the toolbar and see your annotations. You should have 1 for each section or region you want to export tiles for.
TIP: If you want the brush to be larger or the wand to be less sensitive, zoom out (scroll) so the tissue is smaller on your screen.
TIP: Make sure you’re not in selection mode, or you’ll notice your annotation disappears when you release the mouse. Toggle with Shift+S or in Tools > Selection Mode.
5. For each image, capture an overview of the section (optional)
Sometimes it can be helpful to capture a low-ish resolution overview of the entire section. For instance, it might be useful to be able to easily relate an individual tile back to its context within the larger tissue structure. If your annotation captures a subset of the tissue, this can also be a useful way to capture that information.
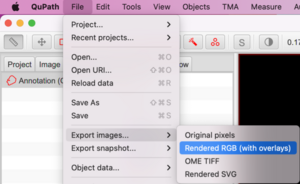
First, select an image
Go to File > Export images… > Rendered RGB (with overlays)
In the dialog box that pops up, choose PNG for the Export format and choose Downsample factor of at least 20 or whatever produces a reasonable output image size:
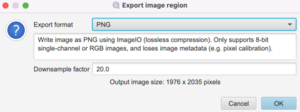
Make a folder called ‘snapshots’ to save the images in. It should be on the same level as raw_data.
6. Export tiles using a script
Drag and drop the file ‘tile_exporter_newnames.groovy’ from the scripts folder into QuPath. This will open the ‘Script editor’ window. This script was adapted from a image.sc forum thread by Pete Bankhead and Mike Nelson and was tweaked for this experiment.
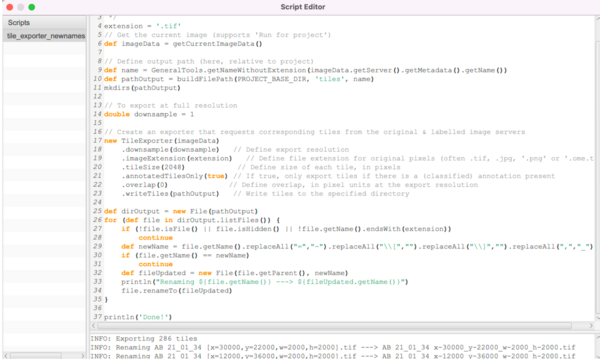
When you open the script, this Script Editor window will pop open:
Here is the script itself. You can open a new script and paste this in:
/**
 * Script to export image tiles (can be customized in various ways).
 */
extension = '.tif'
// Get the current image (supports 'Run for project')
def imageData = getCurrentImageData()

// Define output path (here, relative to project)
def name =
GeneralTools.getNameWithoutExtension(imageData.getServer().getMetadata().getName())
def pathOutput = buildFilePath(PROJECT_BASE_DIR, 'tiles', name)
mkdirs(pathOutput)

// To export at full resolution
double downsample = 1

// Create an exporter that requests corresponding tiles from the original & labeled image servers
new TileExporter(imageData)
    .downsample(downsample)   // Define export resolution
    .imageExtension(extension)   // Define file extension for original pixels (often .tif, .jpg, '.png' or '.ome.tif')
    .tileSize(2048)            // Define size of each tile, in pixels
    .annotatedTilesOnly(true) // If true, only export tiles if there is a (classified or unclassified) annotation present
    .overlap(0)              // Define overlap, in pixel units at the export resolution
    .writeTiles(pathOutput)   // Write tiles to the specified directory

def dirOutput = new File(pathOutput)
for (def file in dirOutput.listFiles()) {
    if (!file.isFile() || file.isHidden() || !file.getName().endsWith(extension))
        continue
    def newName = file.getName().replaceAll("=","-").replaceAll("\\[","").replaceAll("\\]","").replaceAll(",","_")
    if (file.getName() == newName)
        continue
    def fileUpdated = new File(file.getParent(), newName)
    println("Renaming ${file.getName()} ---> ${fileUpdated.getName()}")
    file.renameTo(fileUpdated)
}

println('Done!')
To run the script for a single image: Open an image from the Image list on the left side. Then run the script for each image with cmd+r / ctrl+r or by going to Run > Run when you have the Script editor window selected.
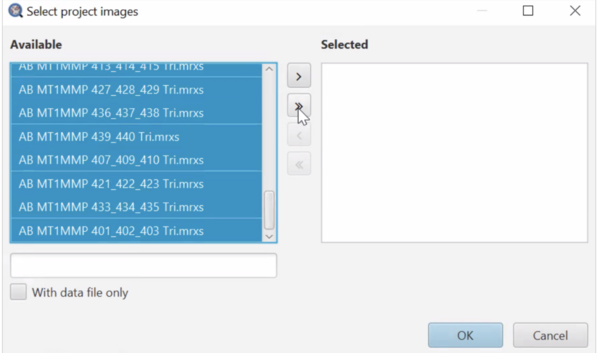
To run the script for many/all images: In the script editor window, select Run > Run for project. Then in the “Select project images” popup (see below), you can select multiple images you’d like to run and add them to the “Selected” list by pressing the “>” button. You can also use the “>>” button to add all images to the “Selected” list. The “<” and “<<” buttons remove highlighted and all images from the “Selected” list, respectively. Remember, images must have annotations or they will be skipped. See below:
Then click “OK” and this will batch process all the images in your project
Errors and status info will be present at the bottom of the Script editor window.
You can find the exported tiles in your qupath_project folder > tiles. Tiles from a single image will be grouped together in a subfolder.
Understanding how the tiles relate to each other:
The tiles will start with the upper left-most part of the annotation and then scan down. You can think about it making a column on the left-most part of the image, then making tiles down that column, then move to the right and generate tiles down the column again:
Example of scanning pattern:
.  .  .  9  15
.  .  6  10 16
.  3  7  .  17
1  4  .  11 18
2  5  .  12 19
.  .  .  13 20
.  .  8  14 21
Final file structure
Here is what the file structure looks like when you’re done:
.
├── snapshots/
├── raw_data/
│   └── Expt_1_condition_1/
│       ├── sample_id_1/
│       │   ├── .dat
│       │   ├── .dat
│       │   ├── ...
│       │   └── Slidedat.ini
│       └── sample_id_1.mrxs
└── qupath_project/
    ├── classifiers/
    ├── data/
    ├── project.qpproj
    ├── project.qpproj.backup
    └── tiles/
        ├── sample_id_1/
        │   ├── .tif
        │   ├── .tif
        │   └── ...
        └── sample_id_2/
These files can be super useful to train machine learning classifiers (as was the purpose in this particular project) such as using our lab’s deep learning tool Piximi or ilasik.
More information about the exporting options in QuPath can be found here. Additional script variants and details about using tileExporter can be found here.