Pearl V. Ryder
The Robust Background algorithm is a powerful algorithm for automatically setting thresholds to segment objects of interest when your image contains mostly background. However, since it contains the largest number of tunable parameters of any thresholding algorithm in CellProfiler, it can be confusing to configure and understand how this method works.
Visualizing the distribution of pixel intensities using a histogram can be a very useful way to understand and select an appropriate thresholding method for a dataset. The automatic thresholding methods in CellProfiler calculate a pixel intensity threshold where any value greater than that threshold is considered foreground and any value below that threshold is considered background. Methods such as Otsu and Minimum Cross Entropy attempt to fit peaks to separate the background (peak at low intensity) from objects of interest (peak at high intensity). The Robust Background method, on the other hand, works well when the image is predominantly background (one peak only at low intensity).
In order to understand these differences, we’ll start by visualizing histograms of intensity values for two different images. Panel A shows an image of a nuclear stain where the nuclei occupy ~ 30% of the image. The histogram for the image in (A) shows a peak of low intensity values and a peak of high intensity values. In contrast, panel B shows an image that is mostly background with a few bright bright spots that cover very little of the image (most of the image is black). The histogram for this image shows only a low intensity peak. While there ARE a few pixels with brighter intensity there aren’t enough to form a visible peak in the histogram. Since this image has only one visible peak at the low intensity values (reflecting the fact that most of the pixels in the image are background), a peak fitting approach won’t work well. If you’re working with images that look like the image in (B), then I’d recommend trying out the Robust Background method instead!

How does the Robust Background method work, then? This algorithm first trims the brightest and dimmest pixel intensities to remove outliers and the true signal so that all the pixels that remain represent only the background intensity levels. It then calculates the central value for the background intensities and calculates the variance within that population. The threshold is then calculated by adding the average to N * the variance. Since this method relies on first clipping all the true signal out of the image based on a percent of the image, it does NOT perform well when some images in a dataset have 5% of pixels with true signal and other images have 25% of pixels with true signal. If the percentage of image that is signal is consistent, however, it can be very helpful.
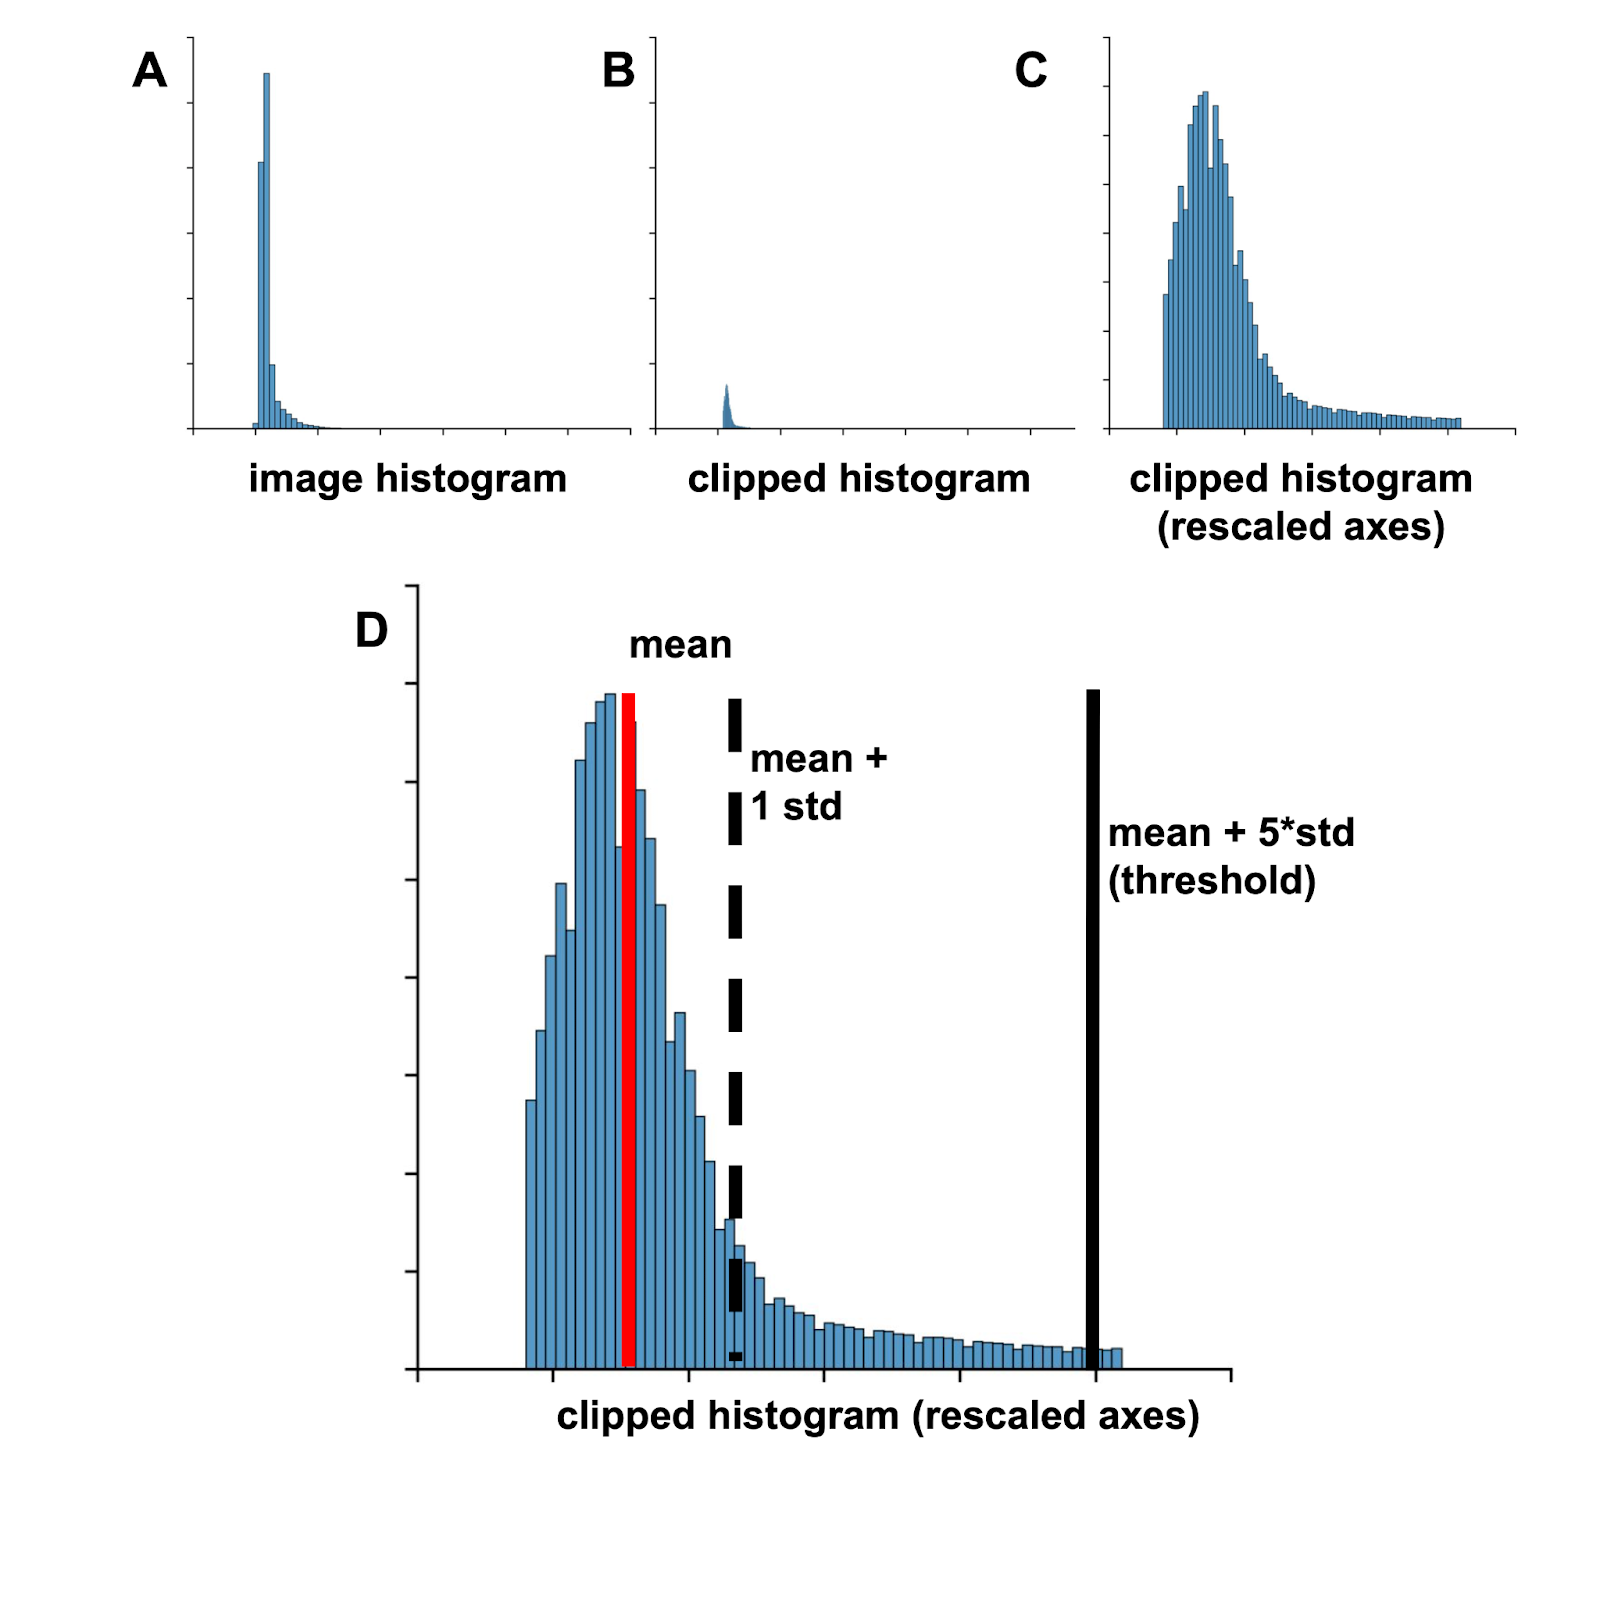
In order to visualize this method, consider the histograms below. (A) shows the original histogram of intensity values for the image in panel B above. I removed the lowest 5% of intensity values and the highest 5% of intensity values in order to create the clipped histogram (B). Clipping removes very small or very large values which would skew the mean and the standard deviation. In (C), you can see the distribution of the clipped histogram with rescaled axes to make visualization easier. Finally, the bottom panel shows the mean of the clipped data (red line), the mean + 1 standard deviation (dashed black line) and the mean + 5 standard deviations (black line). In the Robust Background method, the intensity value corresponding to the black line would be the threshold -- any pixel with an intensity greater than that value (to the right of the black line) would be included as foreground and pixels with intensity value lower than that value (to the left of the black line) would be background.
Within CellProfiler, you can configure the methods to calculate the central value and variance (such as using mean and standard deviation or median and median average deviation), the percentages to trim from the low and high intensity values, and the number of times to multiply the variance before adding it to the central value. For example, if I noticed that approximately 10% of the pixels in the images in my dataset are true signal, then I would increase the upper outlier fraction to at least 10%. On the other hand, if I wanted to increase the stringency of the threshold, I might change the threshold to the mean + 10 standard deviations.
In summary, Robust Background is a very useful tool for images that contain mostly background or images of varying brightness where the objects of interest are consistently ~ N times brighter than the background. The CellProfiler help manual has more information about these methods and is available on the CellProfiler website. Finally, the CellProfiler development team is always available for troubleshooting at the Scientific Community Imaging Forum at image.sc. Good luck with your analysis!